
Configure analytics
Set up the per-project analytics configuration and the goals that matter for this shop.
Analytics
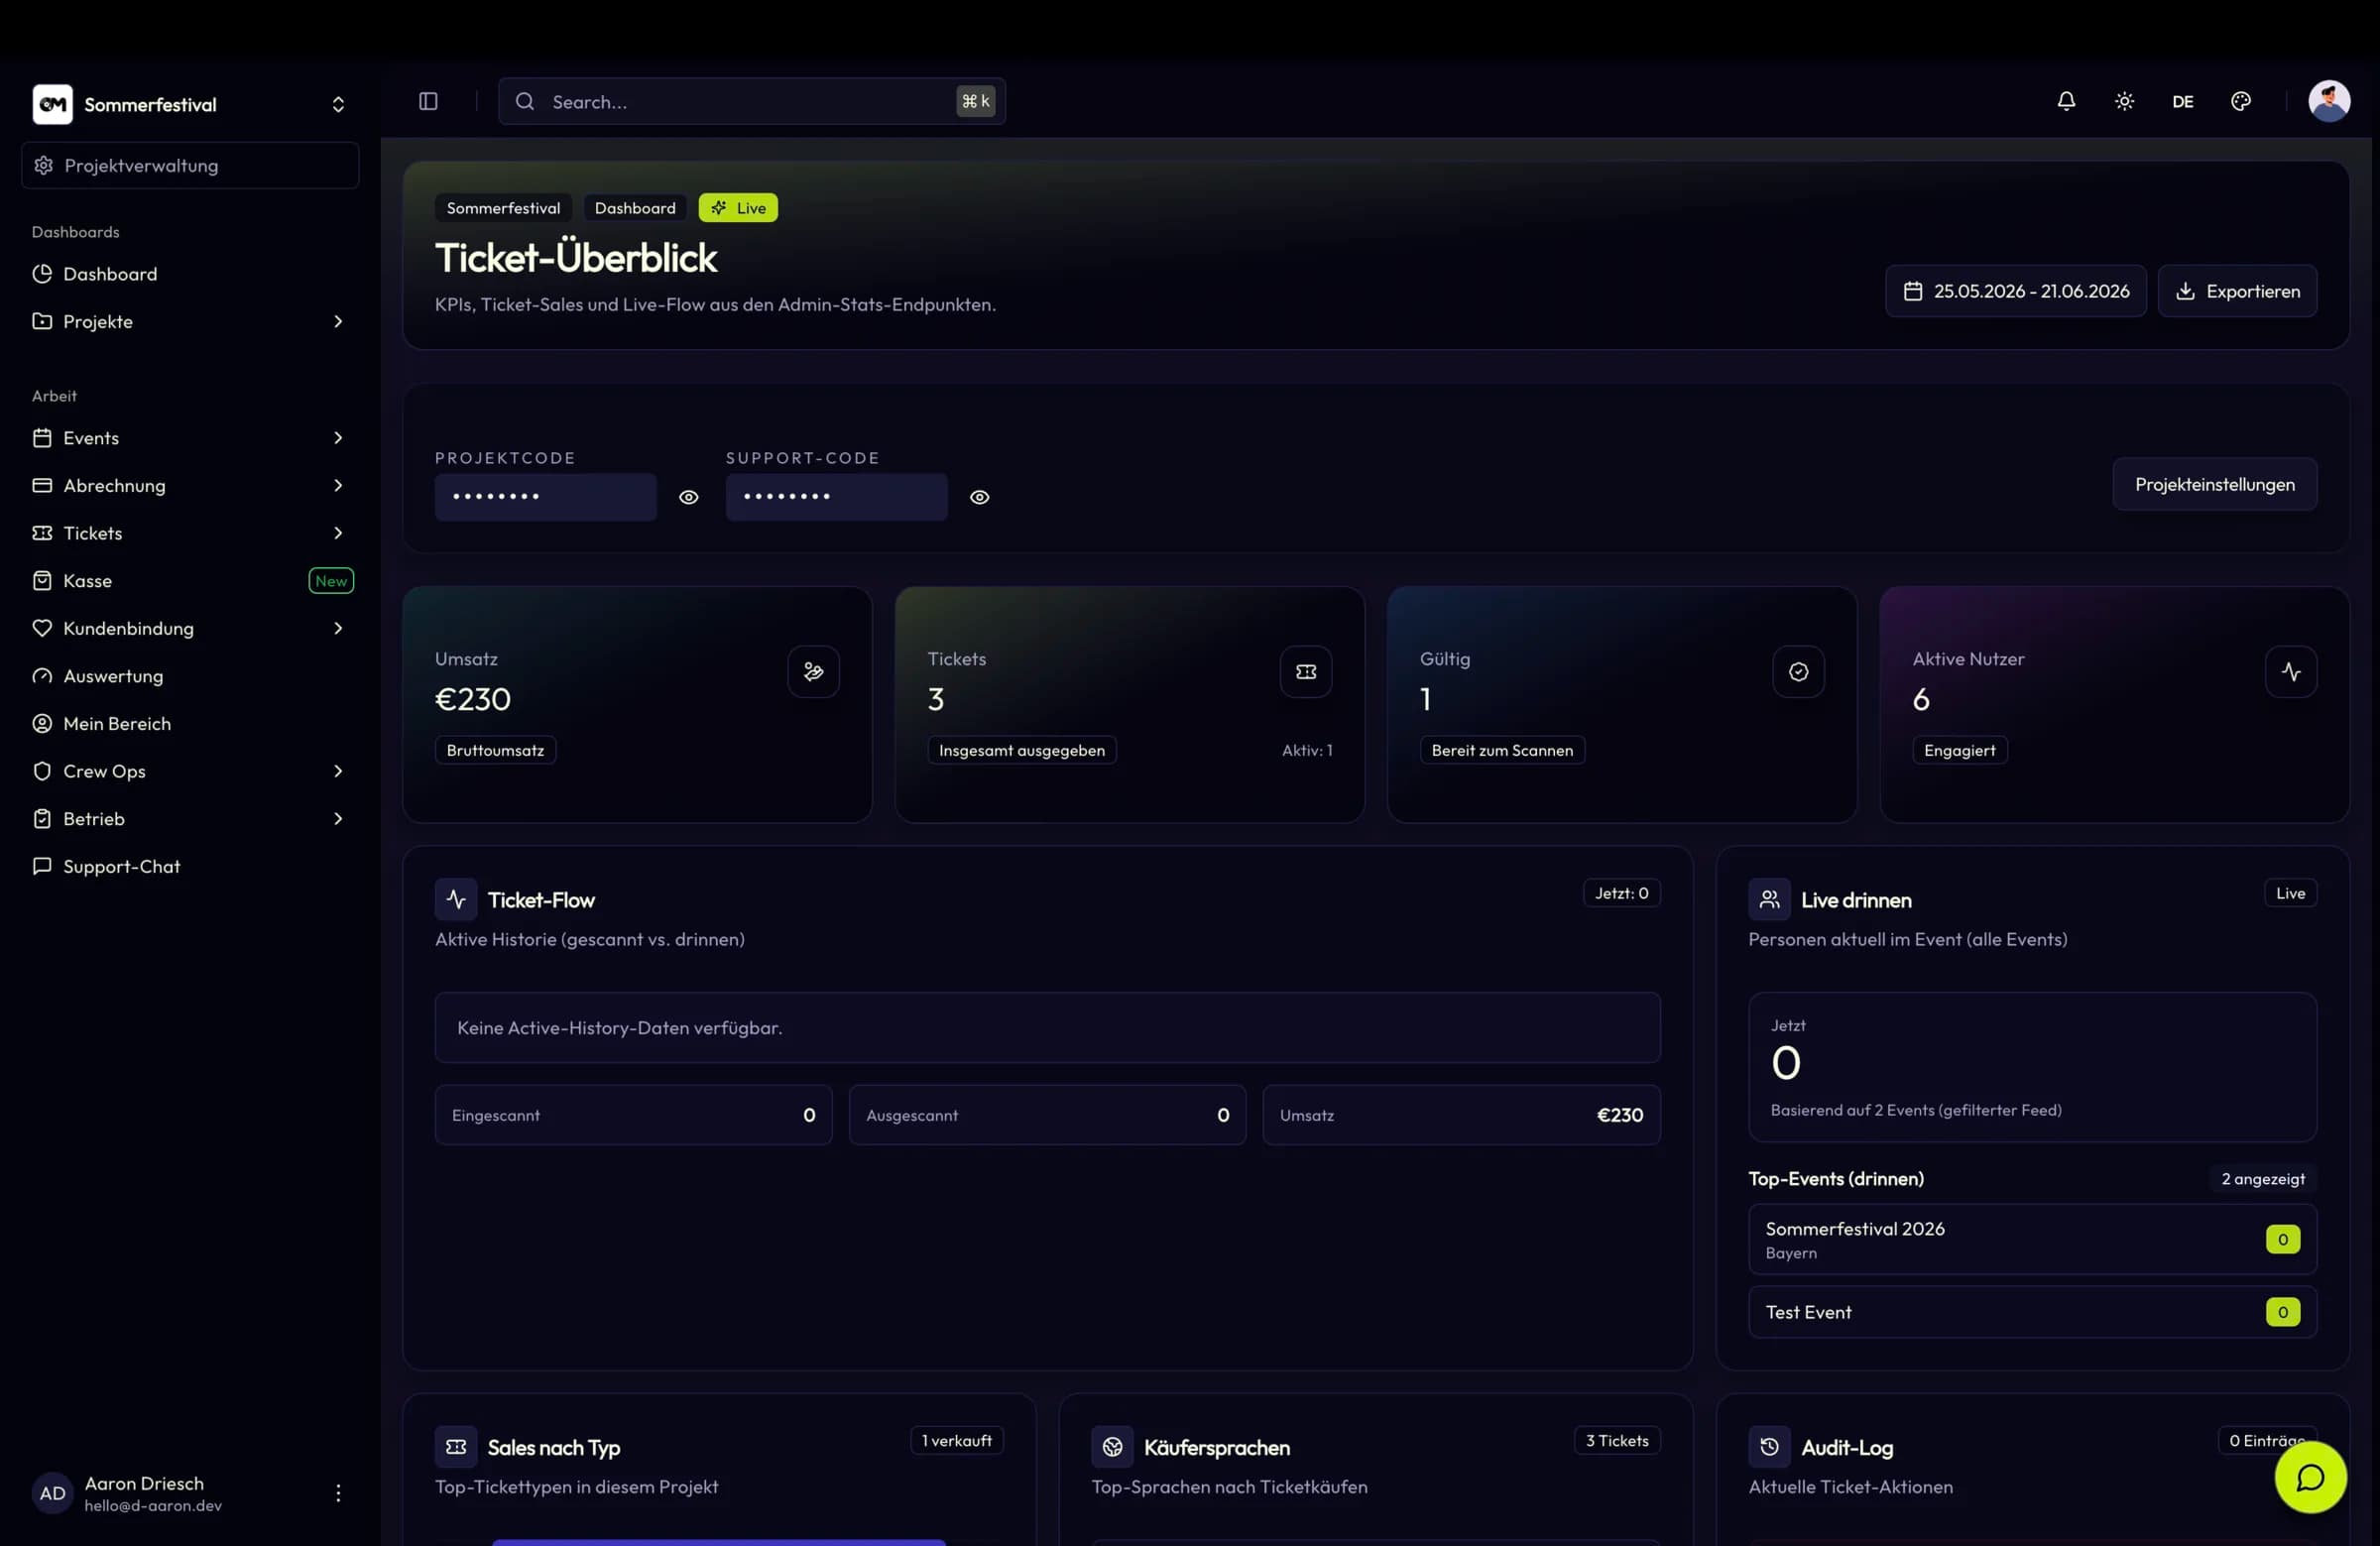
Overview metrics, live and time-series views, funnels, goals, errors and retention — per project, next to the ticket KPIs and ops analytics that come with the rest of the platform.
In short
Overview, live and time-series perspectives
Funnel, goal, error and retention analysis
Ticket KPIs and separate ops analytics
Analytics
Because analytics, ticketing and CrewOps sit in the same platform, the fill rate, the no-show rate, the conversion funnel and the revenue curve all describe the same event. That is what makes a post-event review actionable instead of anecdotal.
Capabilities
A per-project summary of how the shop and the events are performing, without assembling it from exports.
Watch what is happening right now and compare it against the trend over time in the same place.
The behavioural layer beneath the sales numbers, so a drop in revenue can be traced to where people actually stopped.
Define what a successful path looks like and measure how many complete it, step by step.
Error analysis surfaces what is breaking, retention analysis shows who comes back — the two questions a revenue chart cannot answer.
Sales figures, status distributions and dashboard metrics give operators the fast read they need day to day.
Specifications
How it works
Set up the per-project analytics configuration and the goals that matter for this shop.
Follow the on-sale as it happens with the live and time-series perspectives.
Find the step where buyers stop, and check errors and sessions to understand why.
Change the campaign, price phase or checkout, then compare the funnel against the previous run.
Use cases
A multi-week on-sale where the funnel tells you which phase actually moved volume.
Season-long retention analysis showing which segments renew and which quietly stop coming.
A live view during an on-sale, and an error analysis when something goes wrong at scale.
FAQ